
Paragraph 1: Definitions and assumptions
A monopoly is "a market structure where there is only one firm in the industry, so the firm is the industry." The model of monopoly rests on the following assumptions:
- There is a single firm in the industry, so the firm is the industry.
- The firm produces a unique good with no close substitutes.
- There are high barriers to entry, which prevent other firms from entering the industry.
- The firm aims to maximise profit.
Allocative efficiency is "the socially optimum level of output". It occurs when resources are allocated so that society produces the quantity of each good that it values most. For a single good, this is where marginal social benefit equals marginal social cost (MSB = MSC), or, assuming no externalities, where marginal benefit equals marginal cost (MB = MC) and price equals marginal cost (P = MC), so that community surplus is maximised.
Paragraph 2: The monopolist's output
Figure 1 shows a monopolist, with price, cost and revenue on the vertical axis and quantity on the horizontal axis. It shows a downward-sloping demand curve labelled D = AR = MB = MSB, a steeper marginal revenue curve, MR, below it, a U-shaped marginal cost curve labelled MC = MSC (assuming no externalities) and a U-shaped average cost curve, AC, with MC passing through the minimum point of AC. MR crosses MC on the rising section of MC at point E, giving the monopolist's output Qm. A vertical line from Qm meets the demand curve at price Pm. The demand curve crosses the rising section of MC at point F, giving the socially optimal output Qc and price Pc. Qc lies to the right of Qm, and Pc lies below Pm. The triangle bounded by the demand curve, the MC curve and the vertical line at Qm, between Qm and Qc, is shaded and labelled "deadweight loss".
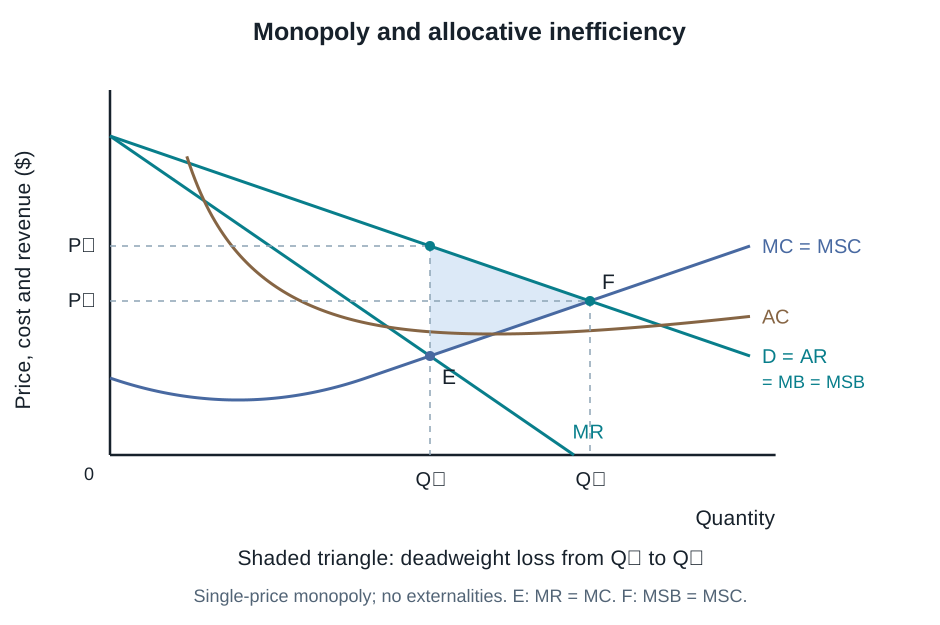
Because the monopolist is the only firm in the industry, it faces the downward-sloping market demand curve, which is also its AR curve. The demand curve also shows consumers' marginal benefit, because it shows how much they are willing to pay for each unit. The MR curve lies below demand, because to sell one more unit the monopolist must lower its price on all units, so the extra revenue from the last unit is less than its price. The MC and AC curves are U-shaped. As the firm adds variable inputs to its fixed inputs, it first experiences increasing marginal returns, so MC falls. Beyond a certain output, it experiences diminishing marginal returns, so each extra unit costs more to produce and MC rises. MC cuts AC at the minimum point of AC, because whenever the cost of an extra unit is below the average, it pulls the average down, and whenever it is above, it pulls the average up. MR = MC and D = MC both occur on the rising section of MC.
The monopolist maximises profit where MR = MC, at Qm. At outputs below Qm, MR > MC, so each extra unit adds more to revenue than to cost, and producing it raises profit. At outputs above Qm, MC > MR, so each extra unit adds more to cost than to revenue, and producing it reduces profit. Profit is therefore greatest at Qm, and the monopolist charges Pm, the highest price consumers will pay for that quantity. This is possible because of its market power. Since it faces the whole market demand curve and barriers to entry keep out rivals, the monopolist can restrict output in order to raise its price. Each unit it does not produce allows it to charge a higher price on all the units it does sell. No rival can enter to supply the units it has chosen not to produce.
Paragraph 3: The socially optimal output
The socially optimal output is where the demand curve crosses the MC curve, at Qc. The demand curve shows consumers' willingness to pay, which is how much they value each unit, so it measures marginal benefit to society. Assuming there are no externalities, MC is the marginal cost to society of the resources used to produce each unit. At Qc, therefore, MB = MC: the value society places on the last unit is exactly equal to the cost of the resources used to produce it. Looking at society as a whole, this output maximises welfare, because every unit whose benefit exceeds its cost is produced, and no unit whose cost exceeds its benefit is produced.
The monopolist does not produce Qc. For every unit between Qm and Qc, the demand curve lies above MC, so MB > MC: consumers value the unit more than it costs to make, and producing it would make society better off. However, the monopolist will not produce these units. In this range, MR has fallen below MC, because selling more requires a lower price on all its units. Each of these units would therefore reduce its profit, and as a profit maximiser it stops at Qm. Beyond Qc, MC > MB: the cost of the resources used would be greater than the value society places on the extra unit, so producing it would make no sense for society either. Only Qc is allocatively efficient, but the monopolist produces the smaller output Qm. At Qm, P > MC, or MB > MC.
Paragraph 4: Deadweight loss and allocative inefficiency
The deadweight loss follows from these two points: the monopolist stops at Qm, while society's optimum is at Qc. For each unit between Qm and Qc, the gap between the demand curve (MB) and the MC curve is the net benefit that unit would have added to society. Because these units are never produced, this net benefit is lost. The total loss is the shaded triangle between the demand curve and MC from Qm to Qc in Figure 1. Compared with the socially optimal outcome at Qc and Pc, consumer surplus falls in two ways. Part of it is transferred to the monopolist as higher profit, through the higher price Pm, and part of it is lost entirely, because fewer units are bought. Producer surplus gains from the higher price, but also loses the surplus on the units no longer sold. These lost parts of consumer and producer surplus together make up the deadweight loss. Neither consumers nor the monopolist receive them, so community surplus is not maximised.
This means the monopolist does not produce at the allocatively efficient level. Too few resources are allocated to producing the good: at Qm, the last unit is valued by consumers at Pm, which is above the cost of the resources needed to produce it. Society would therefore be better off if more resources were moved into producing this good. Because the monopolist's market power allows it to keep price above marginal cost (P > MC) and restrict output below Qc, resources are underallocated, community surplus is not maximised, and monopoly results in allocative inefficiency and market failure.