
Paragraph 1: Definitions
A monopoly is "a market structure where there is only one firm in the industry, so the firm is the industry." The monopolist sells a product with no close substitutes and is protected by barriers to entry. A natural monopoly is a firm that has economies of scale so large that it is possible for this single firm alone to supply the entire market at a lower average cost than two or more firms could. Economies of scale are "unit cost advantages that a business may experience as an outcome of increasing its scale of operations": as the firm increases all of its inputs, its long-run average cost (LRAC) falls. A natural monopoly therefore exists because a single firm can supply the entire market demand at a lower average cost than two or more competing firms. This makes it more efficient for the market to be supplied by one firm than by several.
Paragraph 2: The natural monopoly diagram
Figure 1 shows average cost and price ($ per household per year) on the vertical axis and quantity (households supplied, in thousands) on the horizontal axis. It shows a U-shaped long-run average cost curve, LRAC, and a downward-sloping market demand curve, D. LRAC falls to its minimum point, M, at an output of Q_min = 800 000 households and an average cost of $150, and rises beyond it. D cuts LRAC on its downward-sloping section, at point A, at a quantity of Q* = 500 000 households and an average cost of AC* = $200. A is to the left of M. A second point, B, is marked on the falling section of LRAC at Q₁ = 250 000 households and AC₁ = $300. B is labelled "each of two equal-sized firms".
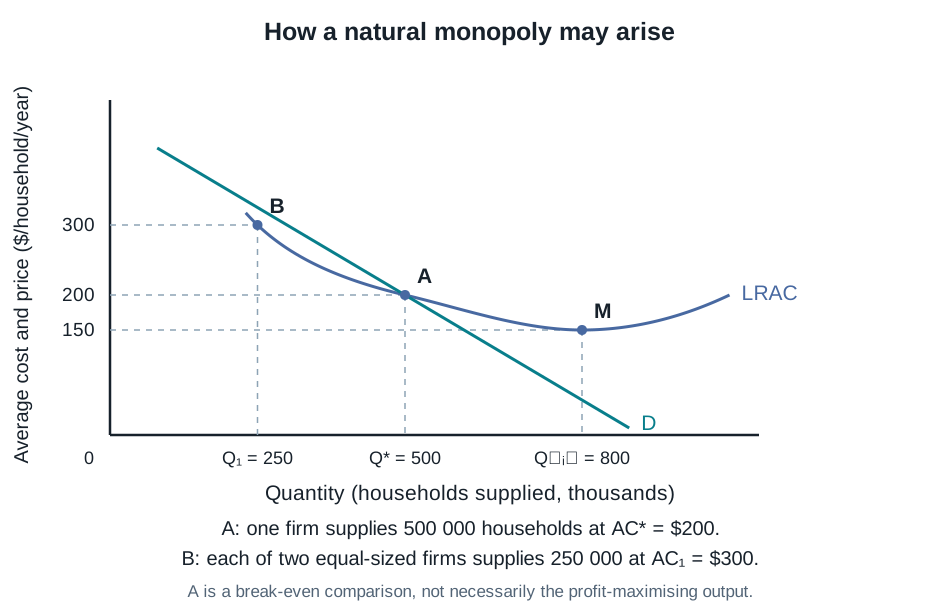
The LRAC curve is U-shaped. Its downward-sloping section is caused by economies of scale. As the firm increases the scale of all its inputs, its average cost falls, for example because it can spread the very large cost of its infrastructure over more units of output, use more specialised labour and management, and buy inputs in bulk. Its upward-sloping section is caused by diseconomies of scale. Beyond a certain size, problems of coordination and communication within a very large firm cause average cost to rise. In a natural monopoly, economies of scale are so large that the minimum point of LRAC, M, lies at an output greater than Q*, where market demand meets LRAC. The rising section of the curve is therefore never reached in practice. The demand curve slopes downwards because it is the market demand curve. Since the monopolist is the only firm in the industry, it faces the downward-sloping demand of the whole market, so it can sell more only at a lower price.
The key feature of Figure 1 is that the demand curve meets LRAC at point A, on the falling section of LRAC, before its minimum point M. At Q*, there are still economies of scale left to gain, since average cost would keep falling until Q_min, but further output could not be sold at a price that covers LRAC. One firm supplying all 500 000 households has an average cost of $200 per household. If the market were split between two equal firms, each would supply only Q₁ = 250 000 households. Each would then operate further up the LRAC curve, at point B, with an average cost of $300. To earn at least normal profit, the two firms would have to charge at least $300, compared with $200 for the single firm. Supplying the market with more than one firm therefore raises average cost and the price needed to cover it, so the lowest-cost way to supply the market is through a single firm. Point A is a break-even comparison, not necessarily the unregulated monopolist’s profit-maximising output. It also shows a limit on the single firm: it cannot produce more than Q* without making a loss. Beyond Q*, the price consumers will pay, read from D, would be below LRAC.
Paragraph 3: How a firm reaches this position
A firm arrives at the position shown in Figure 1 when the cost of supplying the market has two features. It has very high fixed costs, mainly the cost of building infrastructure, and a low marginal cost of supplying each additional customer once that infrastructure exists. A water supply company illustrates this. Before it can supply a single household, it must build reservoirs, treatment works and a network of pipes under every street. These costs are fixed: they are largely the same whether the network serves a few households or every household in the area. Once the network is in place, the extra cost of supplying another household is small, mainly the cost of treating and pumping more water. Over the illustrated output range up to 500 000 households, suppose the company's fixed costs are $50 million a year and the marginal cost per household is $100. Average cost is the marginal cost plus the fixed cost spread over all households: AC = $100 + ($50 million ÷ Q). With 500 000 households, AC = $100 + $100 = $200. With only 250 000 households, AC = $100 + $200 = $300. Because the fixed cost is spread over more and more customers, average cost keeps falling as output grows across the range of output that the market demands. At a larger scale beyond the market’s break-even output, diseconomies of scale would eventually make LRAC rise. For a water company, these include the difficulty of managing and maintaining a vast network. That scale, however, lies beyond what the market demands. This is why demand meets LRAC on its falling section in Figure 1.
This cost structure explains why only one firm supplies the market and why it stays that way. A second water company would have to build its own reservoirs and lay a second set of pipes under the same streets, roughly doubling the industry's fixed costs, while sharing the same households. Each firm would then have higher average costs than a single firm, as at point B. The firm that is already established, supplying the whole market at a lower average cost, could charge a price below a small-scale entrant's average cost while covering its own average cost. A potential entrant knows this and does not enter. The natural monopoly therefore acts as a strong barrier to entry. Firms usually reach this position either by being first to build the network, or by being given the right to build it by the government. Once established, they keep it because a small-scale rival cannot match their costs. The same reasoning applies to gas and electricity distribution, rail track and cable networks, where very large fixed infrastructure costs are spread over the whole market. A natural monopoly can stop being natural, however, if new technology lowers the fixed costs of entry. Mobile phone networks, for example, removed the need to lay a second set of fixed telephone lines, which allowed new firms to compete with the old telephone monopolies.