
An oligopoly is a market structure dominated by a small number of large firms. It rests on several assumptions:
- There is a small number of large firms, each aware of the others.
- Products may be homogeneous, such as oil, or differentiated, such as cars.
- There are high barriers to entry, such as economies of scale, high start-up costs and brand loyalty.
- Firms are interdependent, so the actions of one firm affect its rivals.
Allocative efficiency happens when resources are allocated so that society produces the output it values most. For any single good, this is where marginal benefit equals marginal cost (MB = MC), or equivalently where price equals marginal cost (P = MC), and it maximises social surplus. Allocative inefficiency happens when output differs from this level, so that P ≠ MC and social surplus is not maximised. This is a form of market failure, which is when the free market fails to allocate resources efficiently, resulting in a welfare loss to society.
Because oligopolistic firms are interdependent, they have an incentive to collude rather than risk a price war. When they collude, either formally in a cartel or tacitly by following a price leader, they act together as a single monopolist.
Figure 1 shows the industry drawn like a monopoly. It shows a downward-sloping demand curve labelled D = AR = MB, an MR curve below it, an upward-sloping MC curve (labelled MC = MSC, assuming no externalities), and a U-shaped AC curve. The colluding firms produce Qm, where MR = MC, and charge Pm, read from the demand curve. Because Pm lies above AC at Qm, the rectangle between Pm and AC, with width Qm, is shaded as abnormal profit.
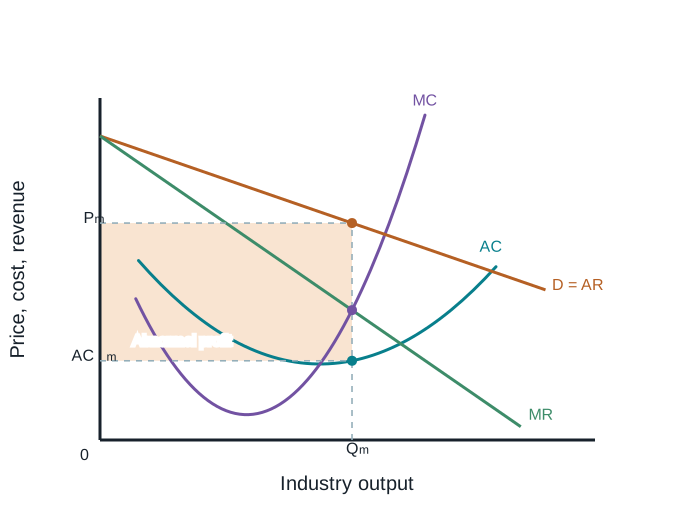
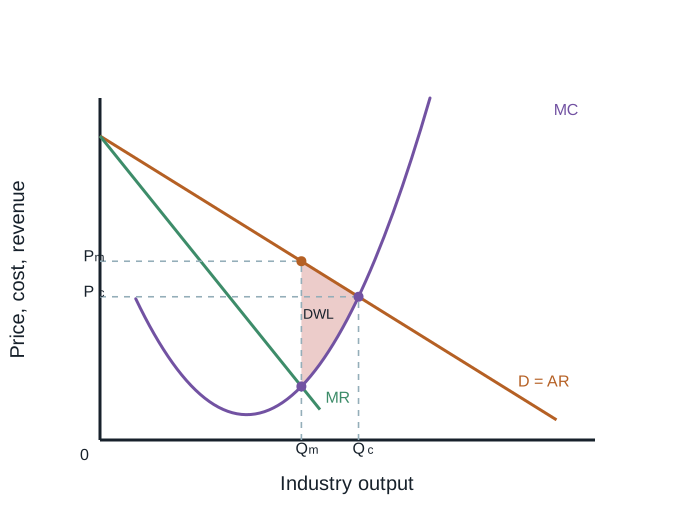
Figure 2 shows the socially optimal output where demand meets MC and the deadweight loss caused by restricting output below it.
The colluding firms have market power because together they supply most of the industry's output and high barriers to entry keep out new competitors. Their demand curve is therefore the downward-sloping market demand curve. To sell more, they must lower the price on all the units they sell, so marginal revenue is less than price (MR < P). They maximise joint profit where MR = MC, at output Qm. Because they face the whole market demand curve, they can set a price Pm that lies above average cost, so they earn abnormal profit (P > AC). Barriers to entry prevent new firms from entering and increasing supply, so this abnormal profit can last in the long run.
The restriction of output by colluding firms also causes a loss of welfare for society.
The socially optimal level of output is Qc, where the demand curve (MB) crosses the MC curve (MSC), so MB = MC. At this point, the value consumers place on the last unit exactly equals the cost of the resources used to produce it, and social surplus (consumer surplus plus producer surplus) is maximised. This is the output a perfectly competitive industry would produce, at the lower price Pc.
The colluding oligopoly instead produces at Qm, which is less than Qc, and charges Pm, which is higher than Pc. At Qm, Pm > MC, so MB > MC, and the industry is underproducing.
Marginal analysis shows why this is inefficient. For every unit between Qm and Qc, the height of the demand curve (the marginal benefit to consumers) is above the MC curve (the marginal cost to society). Each of these units would add more to society's welfare than it costs to produce, so producing it would increase social surplus. The colluding firms choose not to produce these units, because for them MC > MR beyond Qm: selling an extra unit would mean lowering the price on all units already sold, so the extra revenue would be less than the extra cost and joint profit would fall. Beyond Qc, the reverse is true: MC > MB, so producing more would waste resources. Only at Qc is social surplus maximised.
Figure 2 shows the welfare effects. At Qm and Pm:
- Consumer surplus is the area below the demand curve and above Pm, up to Qm. This is smaller than it would be at Qc, where consumers would pay only Pc and buy more.
- Producer surplus is the area above the MC curve and below Pm, up to Qm. The higher price transfers some surplus from consumers to producers, although the fall in output means total producer surplus need not be larger than under perfect competition.
- Deadweight loss is the triangle between the demand curve and the MC curve, from Qm to Qc. This is surplus that neither consumers nor producers receive, because the units that would have generated it are never produced. It is the welfare loss to society from allocative inefficiency.
Since Pm > MC, social surplus is not maximised. Collusive oligopolies are therefore allocatively inefficient, and the market fails.
Allocative inefficiency exists in oligopolistic markets because firms, especially when they collude, have market power and face a downward-sloping demand curve, so MR < P. In the case shown, producing where MR = MC also lets them earn abnormal profit, but it means P > MC, or MB > MC. Output is restricted below the socially optimal level Qc, part of consumer surplus is transferred to producers, and a deadweight loss arises, so social surplus is not maximised.