
Price elasticity of demand (PED) is defined as a measure of the responsiveness of the quantity demanded of a good or service when there is a change in its price. It is calculated as PED = (% Change in Qd) ÷ (% Change in P), using its absolute value to classify demand as elastic or inelastic. Total revenue (TR) is "the aggregate revenue gained by a firm from the sale of a particular quantity of output", equal to price multiplied by quantity sold (TR = P × Q). An indirect tax is a tax on spending on goods and services, such as an excise duty on cigarettes or petrol, which is paid to the government by the firms that sell them. An understanding of PED is important for firms because it tells them how a change in their price will affect their total revenue. It is important for the government because it tells them how an indirect tax will affect both the quantity consumed and the amount of tax revenue raised, so they can choose a tax that achieves their objective, whether that is high tax revenue or lower consumption of a harmful good. This essay argues that PED is an important guide for both firms and the government. Its usefulness is limited, however, because PED is difficult to estimate, changes over time, and is only one of many factors that determine revenue.
When a firm raises its price, two things happen to its total revenue. It earns more on each unit it still sells, but it sells fewer units, because quantity demanded falls. Whether TR rises or falls depends on which effect is larger, and this depends on PED.
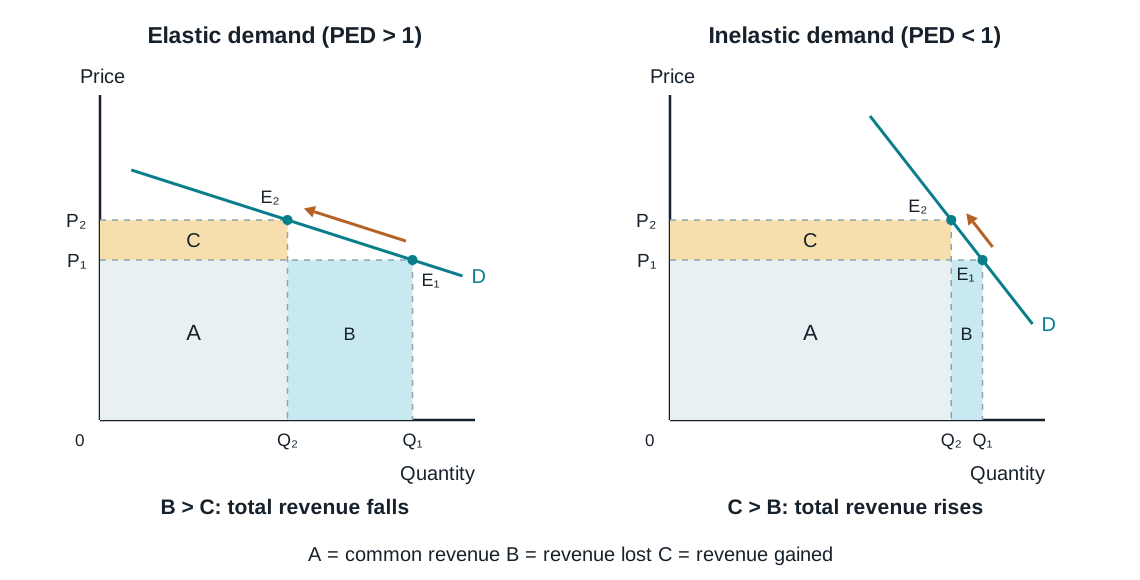
In both panels of Figure 1, the firm raises its price from P₁ to P₂, and quantity demanded falls from Q₁ to Q₂, a movement along the demand curve from E₁ to E₂. TR before the price rise is P₁ × Q₁, which is area A + B. TR after the price rise is P₂ × Q₂, which is area A + C. Area B is the revenue lost because fewer units are sold, while area C is the extra revenue earned from charging a higher price on the units that are still sold.
In the left panel, demand is price elastic (PED > 1). The price rise causes a more than proportionate fall in quantity demanded, so the revenue lost, area B, is larger than the revenue gained, area C, and this means that the overall TR falls. In the right panel, demand is price inelastic (PED < 1). The same price rise, ceteris paribus, causes a less than proportionate fall in quantity demanded, so area C is larger than area B, and TR rises. The reverse applies to a price cut. When demand is elastic, a price cut increases TR, because the large rise in quantity sold more than makes up for the lower price. When demand is inelastic, a price cut reduces TR. A firm that wants to increase its total revenue should therefore raise its price if demand is inelastic and lower its price if demand is elastic. If demand is unit elastic throughout the relevant price range, a price change leaves TR unchanged.
Coca-Cola illustrates this. Its soft drinks have strong brand loyalty, which can make demand relatively inelastic when consumers do not see other brands as close substitutes. In 2022, as its costs rose, Coca-Cola raised its prices across many markets. The company reported that its organic revenue grew by 16% that year, with price/mix growth of 11% and concentrate-sales growth of 5%. Higher prices and a better product mix contributed to revenue growth while sales volumes also grew. These figures illustrate the importance of pricing decisions, but they do not establish a PED estimate, because demand and the mix of products sold also changed. A firm that has a reliable estimate of inelastic demand can expect a price rise to increase revenue, other things being equal.
When the government imposes a specific indirect tax on a good, the supply curve shifts upwards by the tax per unit, so the price consumers pay rises and the quantity bought falls. The government's tax revenue is the tax per unit multiplied by the number of units sold after the tax. PED therefore helps determine both how much revenue the tax raises and how much it reduces consumption; the size of the tax, the initial tax base and PES also matter.
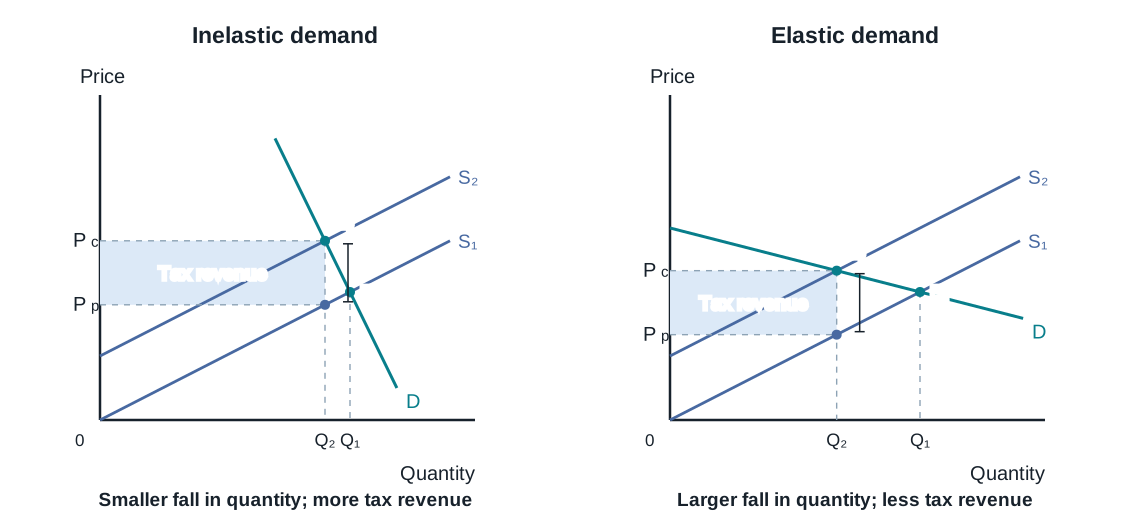
If demand is price inelastic, as in the left panel of Figure 2, the tax-induced percentage fall in quantity demanded is smaller than the percentage rise in the consumer price. Many units are still sold and taxed, so the tax raises more revenue and consumption falls less than in the elastic-demand comparison. If demand is price elastic, as in the right panel, the percentage fall in quantity demanded exceeds the percentage rise in the consumer price. With the same initial equilibrium, supply curve and tax per unit, consumption falls more and fewer units are taxed, so revenue is lower. The lower the PED of the taxed good, the greater the government's tax revenue, other things being equal. A government that wants to raise revenue should therefore tax goods with inelastic demand, such as cigarettes, alcohol and petrol. A government whose main aim is to reduce consumption of a harmful good must recognise that if demand is inelastic, it will need a large tax to achieve a significant fall in consumption.
Mexico's tax on sugar-sweetened drinks illustrates this. In January 2014, Mexico introduced a tax of 1 peso per litre, which was roughly equivalent to 10% of the pre-tax price. One study found that purchases of the taxed drinks were an average of 6% below their estimated level without the tax in the first year, and 12% below that counterfactual by December 2014. If the consumer price rose by 10%, a 6% fall in quantity would imply a rough PED of 0.6, consistent with inelastic demand. The government therefore raised substantial tax revenue, because most sales continued. Consumption still fell, which supported its health objective, but not by as much as the size of the price rise. This shows why PED matters for the government. It allows the government to predict the trade-off between raising revenue and reducing consumption, and to set the size of the tax according to which objective it values more.
However, the importance of PED is limited by the fact that firms and governments rarely know the PED of a good precisely. PED is estimated from past data, but demand also changes with incomes, tastes and the prices of other goods, so it is difficult to separate the effect of price alone. PED also varies along a demand curve and between groups of consumers, so an estimate from one price range or market may not apply to another. If a firm wrongly believes its demand is inelastic and raises its price, it may find that demand is in fact elastic, so its revenue falls instead of rising. If the government underestimates PED, a tax may reduce sales by more than expected and raise less revenue than forecast.
For firms, J.C. Penney is an example. In 2012, the US department store replaced its frequent sales with permanently lower everyday prices, expecting customers to respond positively. Customers instead shopped elsewhere, and its revenue fell by about 25% that year, from around US$17.3 billion to US$13.0 billion. Notably, this case shows the risks of predicting consumer responses, but neither alone identifies a numerical PED or proves that an incorrect PED estimate caused the outcome.
There are also situations where the PED estimate used does not accurately describe the relevant market. If demand is unit elastic over the relevant price range, a price change leaves total revenue unchanged, so a firm cannot raise its revenue by changing its price at all. For the government, raising a tax on a good with inelastic demand may not increase tax revenue if consumers turn to untaxed or illegal alternatives. For example, very high taxes on cigarettes can encourage the smuggling and sale of illegal cigarettes. Total consumption may then hardly fall, but legal, taxed sales fall more than expected, so tax revenue may stay the same or even fall. This is consistent with a more elastic demand for legally taxed cigarettes; it is a limitation of applying a PED estimate for total cigarette consumption to taxed sales, rather than a failure of PED theory.
PED changes over time. Immediately after a price rise, consumers may have few alternatives, so demand is inelastic. Over a longer period, they find substitutes and change their habits, so demand becomes more elastic. Petrol is a good example. A widely cited review of studies found that the PED of fuel is about 0.25 in the short run, but about 0.6 in the long run, as consumers switch to more fuel-efficient cars or public transport. A firm that raises its price because demand is inelastic in the short run may therefore see smaller revenue gains than initially expected as customers gradually switch away. Since both estimates remain below 1, they do not imply that the price rise must eventually reduce total revenue. Similarly, a government that raises fuel taxes may find that the revenue it collects falls over time. Decisions based on short-run PED can therefore be misleading in the long run.
Changes in total revenue and tax revenue do not depend only on PED. PED describes a movement along a demand curve caused by a change in the good's own price, assuming all other factors are constant. In reality, demand curves also shift because of changes in incomes, tastes, the prices of related goods and population. Coca-Cola's sales volumes grew in 2022 partly because demand recovered as restaurants and events reopened after the COVID-19 pandemic, rather than being explained by a movement along an unchanged demand curve. Similarly, as electric cars become more common, demand for petrol shifts to the left, so fuel tax revenue may fall in the long run whatever its PED. A firm or government that focuses only on PED may therefore wrongly predict how revenue will change.
In conclusion, an understanding of PED is important for both firms and the government, because it predicts how quantity demanded will respond to a price change, and therefore how total revenue and tax revenue will change. Mexico's drinks tax shows how the government can use PED to weigh raising revenue against reducing consumption. PED is most useful, however, as a guide rather than a precise rule. It is difficult to estimate accurately, estimates must refer to the relevant taxed or untaxed market, and demand often becomes more elastic over time as consumers adjust. Revenue is also affected by shifts in demand that PED does not capture. In addition, firms care about profit, not only revenue, and governments care about health and fairness as well as tax revenue. On balance, PED is most important for short-run decisions about goods whose demand has been reliably estimated. It becomes less reliable for long-run decisions, and when consumers have easy access to substitutes.