
Price elasticity of demand (PED) is "a measure of the responsiveness of the quantity demanded of a good or service when there is a change in its price." It is calculated as: PED = (% change in Qd) ÷ (% change in P)
Demand is price elastic when PED > 1, which means a change in price causes a more than proportionate change in quantity demanded. Demand is unit elastic when PED = 1, which means quantity demanded changes exactly proportionately given a change in price. Demand is price inelastic when PED < 1, which means a change in price causes a less than proportionate change in quantity demanded.
A straight-line demand curve has a constant slope. A given change in price therefore always causes the same absolute change in quantity demanded, wherever we are on the curve. PED, however, is based on percentage changes. A percentage change depends on the starting value: a change of 1 unit is a large percentage of a small number but a small percentage of a large number. As we move along the curve, the starting price and quantity change, so the percentage changes in the numerator and denominator of the PED formula also change, even though the absolute changes stay the same. PED therefore varies along a straight-line demand curve.
Figure 1 shows a straight-line demand curve, D, with price ($) on the vertical axis and quantity demanded (units) on the horizontal axis. D meets the price axis at $100 and the quantity axis at 100 units, so its equation is P = 100 − Q and its slope is −1. Three points are marked on D. Point A is at a price of $80 and a quantity of 20 units, on the upper section of the curve. Point B is at the midpoint, at a price of $50 and a quantity of 50 units. Point C is at a price of $20 and a quantity of 80 units, on the lower section.
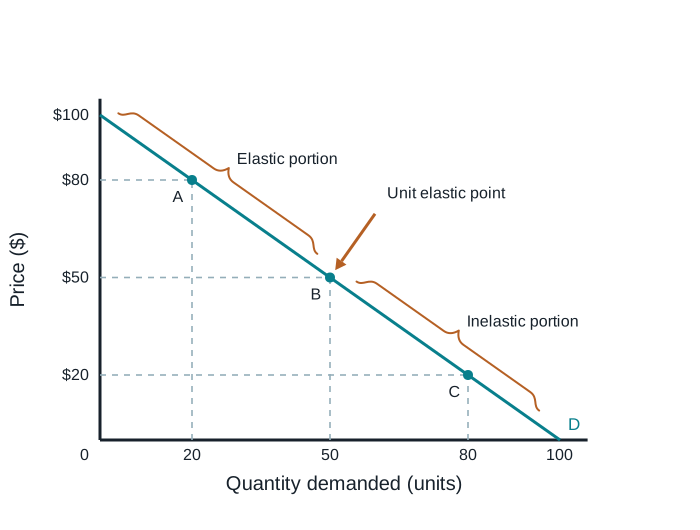
At point A, the price falls from $80 to $79, which is a 1.25% fall. Quantity demanded rises from 20 to 21 units, which is a 5% rise. Here, the PED = 5% ÷ 1.25% = 4, so demand is price elastic. The 1-unit rise in quantity is a large percentage of the small starting quantity, while the $1 fall in price is a small percentage of the high starting price.
At point B, the price falls from $50 to $49, a 2% fall, and quantity demanded rises from 50 to 51 units, a 2% rise. PED = 2% ÷ 2% = 1, so demand is unit elastic.
At point C, the price falls from $20 to $19, a 5% fall, while quantity demanded rises from 80 to 81 units, a 1.25% rise. PED = 1.25% ÷ 5% = 0.25, so demand is price inelastic. Now the 1-unit rise in quantity is a small percentage of the large starting quantity, while the $1 fall in price is a large percentage of the low starting price.
Because the numerator (% Change in Qd) is greater at the top portion of the demand curve, and the denominator (% Change in P) is greater at the bottom portion of the demand curve, it would follow that the PED would initially be large due to a large numerator and low denominator, and slowly fall as the numerator falls and denominator increases. Demand is therefore price elastic on the upper half of the curve, unit elastic at the midpoint and price inelastic on the lower half.
There is also an economic reason why consumers respond more to price changes at high prices than at low prices. One of the determinants of PED is the proportion of income spent on a good: the larger the proportion of income a good takes up, the more elastic the demand. At the top of the demand curve, the price of each unit is high, so each unit takes up a large proportion of a consumer's income. A price change then has a noticeable effect on the consumer's budget, and consumers have a strong incentive to respond by cutting back their purchases or looking for alternatives. At the bottom of the demand curve, the price of each unit is low, so each unit takes up only a small proportion of income. A change in price is barely noticed, so consumers have little reason to change how much they buy. This helps to explain why quantity demanded is more responsive to price at high prices than at low prices.
This argument should be applied carefully. The proportion-of-income determinant is usually used to compare different goods, such as cars and pens, rather than different points on the same demand curve. It is also about the price of each unit relative to income, not total spending on the good: at point A, consumers buy few units, so total spending is not necessarily higher than at point C. The argument therefore supports the pattern shown in Figure 1, but the precise reason why PED varies along a straight-line demand curve is the mathematical one: the absolute changes in price and quantity stay the same, while the starting values on which the percentage changes are calculated do not.